
I am very glad to announce that I have created a portlet to display Google Charts. I have named it as Google Chartlet and it is available as a community plugin to download.
This portlet demonstrates how to use Google charts to generate reports in Liferay.
This portlet is made using charts4j.
What it has right now?
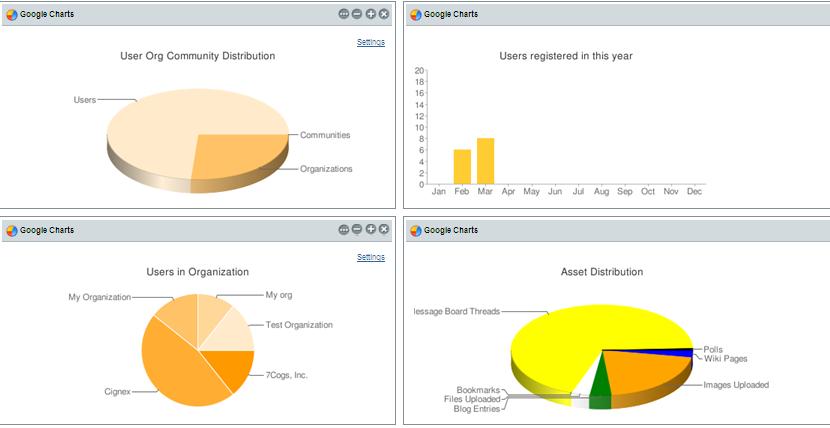
- User Charts - Shows total users, organizations and communities in the system (2D and 3D pie charts)
- Asset Chart - Shows distribution of assets in system(2D and 3D pie charts)
- Sample Charts - These are basically the same charts that are listed in charts4j project page. They are static charts, but show the power of Google charts and Charts4j api
Links
By
Sandeep Nair
Consultant at Cignex, India Office
